There’s a pretty extraordinary clip that I saw on Twitter the other day of Angela Merkel discussing the R0 of COVID-19 in Germany. In it, she explains that R0 is how many people, on average, that an infected person transmits the virus to before they recover. If R0 is greater than 1, the number of infected people grows over time. Eventually, as Merkel explains, the hospital system is overwhelmed with infected. The date that this happens depends on R0.
This is extraordinary for two reasons. The first is the reason that Vox points out in the link above. Living in a country with Donald Trump as a leader, it’s weird to see a leader calmly and rationally explain somewhat complicated scientific concepts. The second is the way in which Angela Merkel discusses R0. She discusses it like yet another scientific parameter, the way she likely discussed temperature or pH in her work as a chemist.
Angela Merkel is not alone in this. This is the way that R0 tends to be discussed in the media and in scientific literature, as a parameter that can be measured and influenced. This is helpful for the purposes of, say, measuring the effectiveness of stay-in-place policies.
However, the supposed simple nature of R0 belies the fact that generating it is a complex process with a lot of assumptions. Those who use R0 should be aware of the process and of the assumptions that go into it. Any model you create using R0 has those assumptions built into it, and you ignore them at your own peril.
In this essay, I’ll explore the assumptions that go into generating R0 a bit, and then talk about the implications of them.
Let’s start with the definition of R0, as it’s actually a little more complex that Merkel lets on. R0 is the average number of people a given infected person will transmit the virus to, assuming an entirely susceptible population. R-effective is the same, but assuming a mixed population (some immune, some susceptible).
Right now, R0 is about the same as R-eff, as most people aren’t immune. As the virus progresses, this will change. Nobody knows exactly how immunity works for COVID-19 right now, which means R-eff is impossible to calculate. So, websites like Rt.live, which purport to calculate R-eff for each state daily, are total nonsense (very pretty, though).
So let’s just discuss R0. R0 has two obvious complications just from the definition.
1. R0 is heavily dependent on circumstance. It’s not an inherent property of the virus. Calculating a state or country-wide R0 means including circumstances with very high R0 (like a trade show or buffet) and circumstances with a low R0 (like isolated farms).
2. R0 assumes that the average is meaningful. This isn’t necessarily the case. If 10 people get COVID-19, and 9 of them are responsible and self-isolate, while the 10th opens a kissing booth at the county fair, you will get a high R0.
This high R0 will be way higher than the number of people who the 9 infected, and way lower than the number of people who the 10th infected. It will describe none of them well. You might think from this that you need to lockdown everyone in order to drive down your R0, while really you just needed to make sure the 10th guy didn’t open up a kissing booth.
Those are the two obvious complications from the definition. The less obvious complications come from how R0 is actually calculated.
R0 is usually calculated by taking a group of infected and non-infected people and observing them really carefully. You carefully track exactly when each non-infected person starts showing symptoms, testing them to make sure. You use your prior knowledge of the virus to guess when exactly that non-infected person became infected. You also use your prior knowledge of the virus to guess who infected them, based on how infectious people are each day after they’re infected.
From there, your model will show you how many non-infected people got infected by each new infectious person. You average them together, and that’s R0.
There are some complicated statistics that go into this (Bayesian inference! Markov chains! Matrices!), but that’s the gist. So let’s list out the inputs into the model:
1. Number of symptomatic people
2. Time from being infected to onset of symptoms
3. How infectious each person is on any given day after they’re infected
The first thing you might notice is that our model automatically ignores asymptomatic transmission. This is a big omission, as asymptomatic transmission is likely a big part of how COVID-19 spreads. Recently, some researchers decided to test every occupant of a Boston area homeless shelter for COVID-19. They found 146 out of 397 (36%) tested positive, but none had symptoms.
It’s impossible to say whether those people were presymptomatic or asymptomatic, but that’s still a big number. That fits in well with other viruses, which also tend to spread asymptomatically.
A lack of testing capacity generally forces us to calculate R0 only from symptoms, which leads into the problems with the second assumption. The relationship between when you’re infected and when you show symptoms is not a simple function of the virus. It depends a lot on your immune system and the viral dose, which is why different people react to the virus differently.
We don’t even know what the relationship of viral dose is to severity of symptoms of COVID-19, as we haven’t been able to do laboratory studies. For other viruses, like norovirus, researchers literally give small amounts of the virus to volunteers and see how little it takes to infect them. It’s hard to imagine doing that for COVID-19, given its deadliness.
Similar issues exist with calculating how infectious carriers are. Infectiousness also depends on the behavior of the subjects, like with my previous kissing booth example. So this input isn’t just a biological issue, but a sociological one.
Given the difficulties of calculating these inputs, we’d expect a variety of outputs. And that’s exactly what we’ve gotten. For COVID-19, for instance, we got an early estimate of 2.2 to 2.7 in Wuhan, then a revised estimate of 5.7 for the exact same region.
This tracks with other viruses. Take norovirus, for instance. Unlike COVID-19, norovirus is a really well-studied virus. It’s been studied since the 50’s, it quickly causes pretty unmistakeable symptoms (namely explosive vomiting and diarrhea), and we’re able to do laboratory studies on it. With all that being said, here are some estimates of the R0 of norovirus from a review paper (note: the names at the bottom are the authors of the papers reviewed).
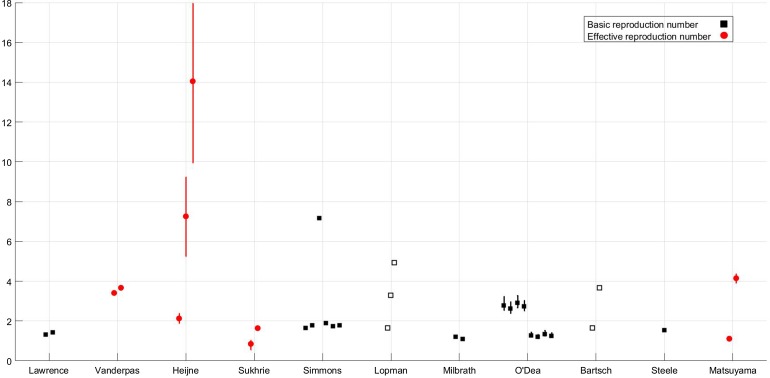
To some extent, this is what you’d expect, given that these are measuring R0 in different situations, from a scout jamboree to a hospital setting. However, imagine Angela Merkel looking at this graph, and then trying to make public policy decisions about managing the spread of norovirus. Would you assume that uncontrolled norovirus in Germany has an R0 of 14, like in Heijne’s paper, or a little less than 1, like in Sukhrie’s paper?
The difficulty in calculating R0 is compounded by the fact that it’s obvious every virus has to dip below an R0 of 1 in some situations. We’re not good at studying those situations, because they end up being papers about the dog that didn’t bark: “In this paper, we discuss a single guy infected with COVID-19, who went home and didn’t infect anyone and then recovered.”
However, we know that the R0 dipping below 1 has to happen, or else most of us (the symptomatic ones) would get an episode of explosive vomiting and diarrhea every year or so, or however long the immunity to norovirus lasts. That should happen especially whenever new strains of norovirus emerge to which our body is not immune. Why aren’t we constantly getting slammed?
I don’t think there’s an easy answer. Not only has there not been enough research done into the inputs of R0 (for COVID-19 or really for any virus), but there’s also so much we don’t know biologically about how this virus works.
So what are our other options? In a robust testing regime, it’d be about simply testing everyone possible, and then testing how we can change the rates of newly infected. Ideally, this would be combined with careful contact tracing, so we’d know who to test. Unfortunately, this is not the world we live in.
Our most realistic option, then, is probably to extrapolate from limited, well-done studies into more widespread policy changes. We measure the impact of the policies as best as we can, and we need to be open to changing them as the facts change.
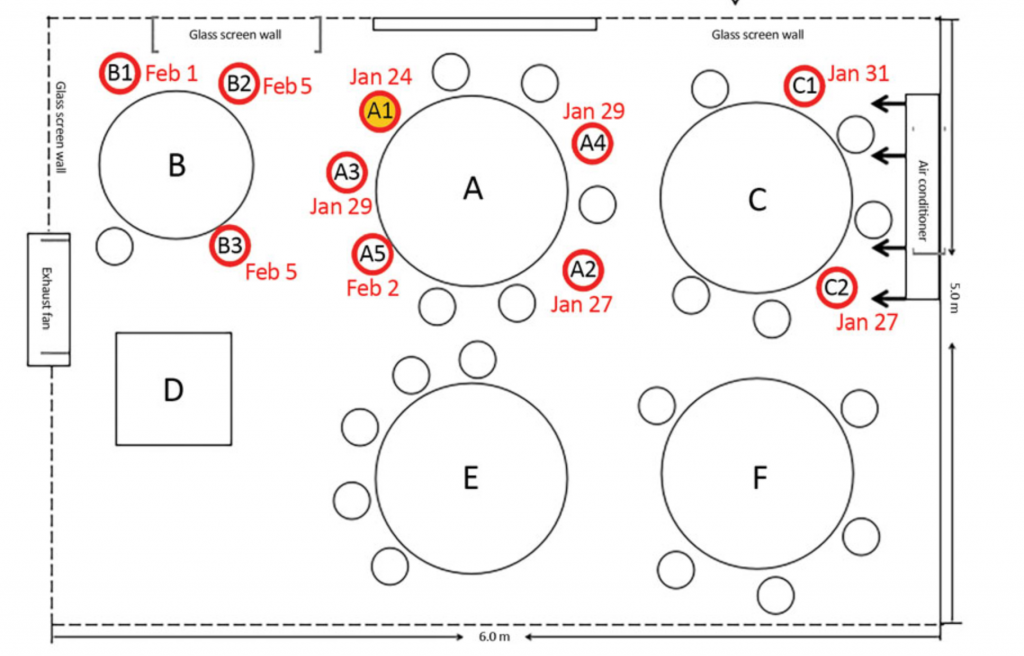
Two COVID-19 studies done recently that I was particularly impressed by were an observation of a South Korean call center, and a Chinese restaurant.
In the South Korean call center, the virus spread widely among people sitting close to one another, and not widely among people sitting far from each other. This was true even though they shared the same elevators.
In the Chinese restaurant, again, infections were limited to close physical proximity.
Instead of worrying about R0, it’d be more prudent to not pack people into close, confined spaces. We could also mandate the wearing of masks, so as to hinder the spread of virus through coughing or loud talking (like what would happen in a call center or crowded restaurant).
It’d be possible to implement these measures without having to resort to the extreme nature of the current lockdown. From there, we could see the effects of these policies on the hospitalization rate, and go from there.